Edit chart
Loading graph
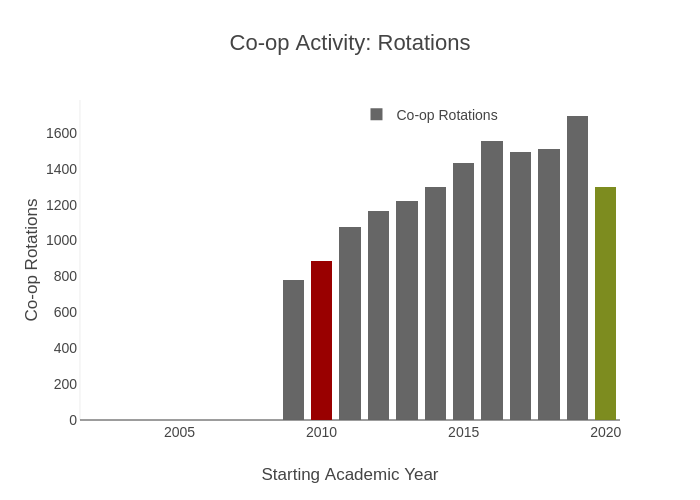
Provostncstate's interactive graph and data of "Co-op Activity: Rotations" is a stacked bar chart, showing Co-op Rotations, Baseline Co-op Rotations, Goal Co-Op Rotations; with Starting Academic Year in the x-axis and Co-op Rotations in the y-axis.. The x-axis shows values from 2001.5 to 2020.5. The y-axis shows values from 0 to 1783.157894736842.